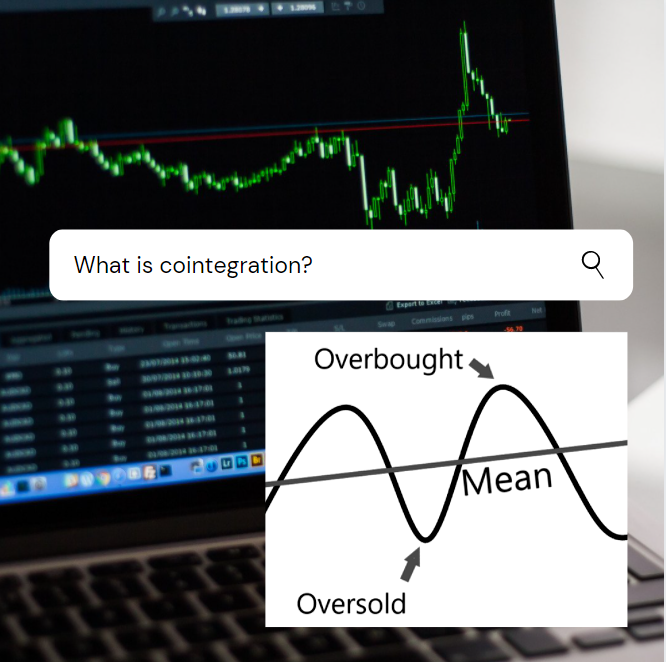
The tale of a drunk and her dog
In 1987, two Nobel prize-winning economists introduced the concept of a co-integrating vector through their research paper (Engle & Granger)¹. (Murray, 1994)² illustrated the concept of cointegration through the now famous tale of “A drunk and her dog”.
A time series is a series of data points ordered in time. For example, the price of a stock over the past 5 years. Two time series may behave like two drunk people wandering around. The two people are independent; there is no meaningful relationship between their paths. Knowing where one of them is, may not help us find the other drunkard. However, given a drunkard’s location, it could be possible to predict, at least to some extent, where her dog might be. Let’s call him Coco. The path followed by both is still unpredictable. However, given the location of one, we might be able to predict the location of the other. In other words, the distance between the two is fairly predictable.
The drunk owner and her dog Coco form a cointegrating pair. Note the probabilistic nature of the cointegration. Coco is not on a leash; the distance between the drunk and the dog is not fixed. However, it is likely that if they end up too far apart, Coco will run back towards his owner, reducing the distance between them to what it usually tends to be.
Cointegration
Simple definition:
Cointegration is a statistical property exhibited by time series data. The movement of two time series together is called cointegration. It refers to a long-run equilibrium relationship between the two time series.
Technical definition :
Mathematically, two time series, say X and Y, are cointegrated if both of them, individually, are integrated of order d [I(d)] but there exists some combination of them, such as, aX + bY, which is integrated of order zero [I(0)].³
Cointegration can be tested for using the Engle Granger and Johanson cointegration tests.
Application in trading strategies
We can extend this concept to financial assets – cointegrated stocks, futures, currencies and more. If the stocks Amazon and Alphabet are cointegrated, there is some relationship between them that could allow us to predict how they are likely to move, in relation to each other. If their ratio tends to remain constant in the long run, long short trading strategies can be built around exploiting the short run deviations from the average ratio. This can be explained in greater detail later; the concept of pairs trading and statistical arbitrage deserves a separate article.
Cointegration vs correlation
These are two separate concepts.
1. Cointegration is the co-movement and mutual association of two time series through some combination of them; correlation refers to the directional relationship between the two time series. Neither necessarily implies causation.
2. Correlation is a short-run concept while cointegration is a long-run concept. Correlations are more unstable and sensitive to the length of the period over which they are calculated.
3. It is possible for a cointegrated pair to be uncorrelated and for a correlated pair to not exhibit any cointegration. For example, two positively correlated stocks may grow further apart in the long run even if they move in the same direction in the short run and vice versa.
The absence of correlation does not indicate independence of two time series.
4. Because of the nature of most of the financial time series data (nonstationary⁴), the correlations between them may be spurious (false). Cointegration is a stronger, more reliable measure. For example, two time series could appear highly correlated simply because both are trending higher over time; they may have no actual relationship. Not only does this lead to absurd results, these results also appear to be falsely statistically significant; the usual T and F statistical tests are not applicable for non-stationary data; they assume stationarity (constant mean, autocovariance).
Example of a spurious corrrelation: The US Defense Expenditure and the population of South Africa has a correlation of 0.97 over the period 1971-1990.⁵
Two time series are cointegrated only if there is a genuine relationship between them. It is possible to create trading strategies based on correlation as well. However, one would be well advised to do a sense check; how meaningful is that relationship and the chosen time horizon?
References:
¹Engle, R. F., & Granger, C. J. (1987, March). Co-Integration and Error Correction: Representation, Estimation and Testing. Econometrica, 55(2), 251-276.
²Murray, M. P. (1994, February). A Drunk and Her Dog: An Illustration of Cointegration and Error Correction. The American Statistician, 48(1), 37-39.
³This is the order of integration concept. An I[1] series needs to be differenced once for making it stationary i.e. I[0].
⁴A non-stationary time series is a time series which does not have a constant mean and autocovariance over time, rendering it useless for prediction, unless transformed into a stationary series.
⁵Examples of spurious regressions:
https://www.google.com/url?sa=t&source=web&rct=j&url=http://www.eco.uc3m.es/jgonzalo/teaching/EconometriaII/examplesspuriousregression.pdf&ved=2ahUKEwiAms6gxcTqAhX-wTgGHaEZA7UQFjAAegQIAhAC&usg=AOvVaw2LPvsBSgMVmpyv8_vA6UqM


